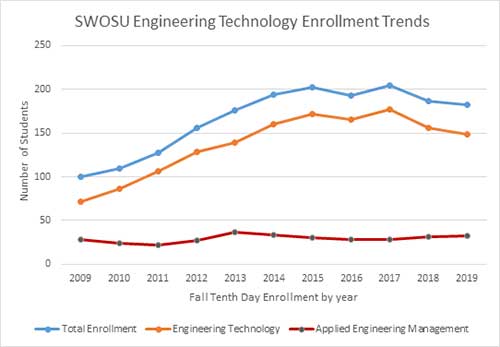
Enrollment data represents the overall enrollment for the Engineering Technology and Applied Engineering Management degree programs based upon the 10th day of classes during the fall semester. Based upon the curricular design of the programs, students do not typically declare their “degree option” until their junior year. Enrollment data exists and is presented only in aggregate form. Enrollment data trends for the past 10 years are shown in the chart below.

| Academic Year | Manufacturing Engineering Technology | Computer Engineering Technology | Environmental Engineering Technology | Total |
|---|---|---|---|---|
| 2015 | 9 | 4 | 3 | 16 |
| 2016 | 10 | 3 | 0 | 13 |
| 2017 | 22 | 2 | 3 | 27 |
| 2018 | 22 | 3 | 1 | 26 |
| 2019 | 29 | 2 | 1 | 32 |
| Academic Year | Manufacturing Technology | Electronics Technology | Environmental Technology | General Supervision | General Technology | Total |
|---|---|---|---|---|---|---|
| 2015 | 6 | 1 | 2 | 1 | 0 | 10 |
| 2016 | 5 | 1 | 0 | 0 | 0 | 6 |
| 2017 | 13 | 1 | 0 | 0 | 0 | 14 |
| 2018 | 8 | 3 | 0 | 0 | 0 | 11 |
| 2019 | 3 | 0 | 0 | 0 | 0 | 3 |
